

Here's April 2015s Monthly Indicators report from the Greater Boston Association of Realtors
[slideshare id=48810701&doc=april2015greaterbostonrealestatemarkettrendsreport-150531161803-lva1-app6892]
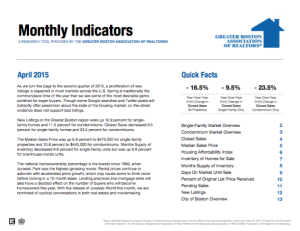
Boston Real Estate Market Trends
Closed sales were down in April as buyer activity was impacted during the winter. April median prices went up because of ongoing low inventory and high demand. New listings added to the market jumped on pent up seller demand.
- April single-family home sales: DOWN -9.5% over April 2014; median prices UP +6.8% ($470,000)
- April condo sales DOWN -23.5% over April 2014; median prices UP +10.8% ($440,000)
- Inventory in April DOWN -17.4% to 2,964 and condos DOWN -18.3% to 1,530
- SF listings added to the market in April UP +12.9% over last year. (2,531 from 2,242 in 2014)
- Condo listings added to the market UP +11.0% over last year. (1,740 from 1,568 in 2014)
Interested In Specific Neighborhood / Area Real Estate Market Trend Data?
The Single-Family Home Market:
- Sales of detached single-family homes declined on an annual basis for a second consecutive month in April, sliding 9 percent, from 862 homes sold last April to 780 in April 2015. Its the lowest sales total for the month of April over the past half dozen years, dating back to April 2009 when only 702 homes were sold, and well below the record sales total for the month set over a decade ago in April 2004 when 1,158 homes sold. Furthermore, the decrease in April home sales is the largest percentage drop in home sales on an annual basis since August 2014 when sales volume declined 10.5 percent from the previous August.
Notably, the decrease in the number of home sales closed in April was not unexpected. Since it typically takes 45-60 days for home sales transactions to be completed, last months sales volume is directly correlated with the heavy snowfall and cold temperatures that plagued the Boston area from late January through early March, hampering buyers ability to view properties and prompting many homeowners to delay listing their home for sale until the weather improved.
On a month-to-month basis, home sales did improve a healthy 9.9 percent from March, which is down from the prior two years when sales rose 21% and 17% between March and April in 2014 and 2013 respectively, but comparable to 2012 when home sales rose 9.4% from March and April.
- The monthly median selling price for single-family homes rose on an annual basis for a seventh consecutive month in April to a new record high price for the month of April of $470,000. This reflects an increase of 6.8 percent over the previous high price set just a year ago when homes sold for a median price of $440,000 in April 2014. Aprils healthy price appreciation follows similarly strong price gains of 6.7 percent in January and 7.9 percent in February, while a more modest increase occurred in March when the median price rose 1 percent. The median selling price for detached single-family homes has now increased on an annual basis in 30 of the past 31 months (dating back to September 2012).
On a month-to-month basis the median selling price saw even stronger appreciation, climbing 8.7 percent from a downwardly revised median price of $432,250 for March. The steady increase in median selling prices reflects todays tight inventory levels, improved optimism about the economy and housing market, and pent-up demand from millennials looking to transition from renters to homeowners, as well as empty-nesters looking to downsize and cash in on strong gains in their homes value in recent years. In fact, just between March to April the ratio of original list price to sales price increased a full point to 97.2 percent, with April marking the twenty-sixth consecutive month in which the ratio of original list price to sales price received by sellers has stood at or above 95 percent.
As of April, the median price is up 51.6 percent from March 2009 when home values bottomed out at $309,950.
- After declining for 28 consecutive months from March 2012 June 2014, the average market time for homes sold has now increased for 10 consecutive months in Greater Boston. Single-family homes sold in April 2015 were on the market an average of 90 days, or roughly one-half week longer than last April when the typical home sold in an average of 86 days. However, on a month-to-month basis, listing time declined by over a week from March when the typical home sold was on the market for an average of 100 days before an offer was accepted.
- After declining each of the two previous months, pending home sales increased on an annual basis during April, climbing 15.3 percent, or 225 units, from the same month last year to 1,700 homes placed under contract. On a month-to-month basis pending sales also improved 43.2 percent from a downwardly revised 1,187 omes placed under agreement in March. Pending home sales are now at their highest level in nearly two years, dating back to May 213 when 1,753 homes were ut under contract.
- The inventory of single-family homes for sale continues to trail historic norms, declining on an annual basis by 17 percent, or more than 600 properties, compared to the same month last year. With 2,964 homes listed for sale as of April 30, the supply of homes on the market is at its lowest level in more than a dozen years.
On a month-to-month basis, the supply level did show modest improvement, with the number of homes for sale increasing 24.6 percent from an upwardly revised 2,379 single-family properties in March. Furthermore, the number of new listings coming onto the market improved nearly 13 percent, or almost 300 units, from the same month a year ago, and 63 percent, or almost 1,000 homes, from March, but those gains will do little to improve market conditions given the current buyer demand, especially given the fact that permitting for new homes remains well below historic norms and many homeowners remain reluctant to list their home for sale either because they owe more on their mortgage then their home is worth or they are fearful of not being able to find another home to purchase due to the lack of homes for sale.
Inventory as expressed in months of supply also declined last month to 3.8 months from 4.2 months of supply in April 2014, but did improve modestly from 3.4 months of supply in March. In a balanced market 7.5 8.5 months of supply exists, so at the current sales pace there remains an insufficient supply of homes available to meet buyer demand.
The Condominium Market:
- Sales of condominiums declined on an annual basis for a sixth consecutive month in April, decreasing 23 percent from 867 condos sold last April to 663 in April 2015. This marks the eleventh time in the past 12 months activity in the condo market has fallen from year ago levels, and is the largest percentage decrease in condo sales on a year-to-year basis since April 2011 when the number of sales closed fell 24.9 percent from the same month one year earlier. Historically, last months closing total is the tenth highest on record for the month, but well below Aprils record high sales total of 1,014 units sold in April 2005. The last time fewer condos sold in April was in 2011 when 653 units closed.
Despite the slower sales pace in April, condominium sales still rose steadily on a month-to-month basis, improving 15 percent from an upwardly revised 576 condos sold in March. Notably, demand for condos remains strong, especially among entry-level buyers looking to convert from renting to home ownership, overseas investors, and suburban empty-nesters looking to downsize or relocate to Boston. Indeed, sales activity would likely be higher if not for the very limited supply of condos available for sale in eastern Massachusetts.
- Even as sales declined, the median selling price for condominiums increased on an annual basis for a sixth consecutive month in April, climbing 10.8 percent over the past year from $397,000 in April 2014 to a new record high median price for April of $440,000 this year. This marks the twenty-fifth time in the last 26 months the monthly median price has risen from the same month one year earlier the lone aberration occurring in October 2014 when the median price slipped 0.6 percent from the same month one year earlier.
On a month-to-month basis, the median selling price declined a modest 2 percent, but notably thats down just slightly from the all-time record high monthly median selling price of $449,000 set in March, and can be attributed in part to a let up in demand as some buyers stepped aside during the period of severe winter weather that occurred from late January through early March. Nonetheless, since the monthly median price bottomed out at $259,500 in January 2009 during the last market correction, the median condo selling price has rebounded by nearly 70 percent.
Like the single-family home market, the condominium market continues to be plagued by a lack of listings to meet current buyer demand, especially at the entry-level end of the market. As a result, sellers are profiting. In fact, the percentage of original list price to selling price rose a full point to 100.4% in April, which marks the fifteenth consecutive month the ratio of list price to sale price has reached or exceeded 98 percent, meaning the typical condo owner was able to sell their unit either at or just below the full original asking price.
- The average market time for condominiums to sell decreased on an annual basis for the third time in the last four months in April. The typical condo sold in April was listed for 57 days before an offer was accepted, which is lowest average days on market until sale this year, and down one day from last April and 12 days from one month earlier when the average days on market was 69 days.
- The number of condominiums placed under agreement rose for a second consecutive month in April, increasing 8.7 percent, or more than 100 units, over the past 12 months to 1,332 condos placed under contract this April. In addition, on a month-to-month basis, pending sales improved 31 percent from a downwardly revised 1,014 units put under contract in March. The number of condos put under agreement in April 2015 is the most of any month since May 2007 when 1,341 condos went under agreement, thus illustrating the strong demand for condominiums in the Greater Boston market.
- The number of condos on the market decreased for a forty-fifth consecutive month in April, declining 18 percent over the past 12 months to 1,530 condos for sale, and by 30 percent since April 2013. Like the single-family market, the current inventory of condos for sale is the lowest monthly listing total in more than a decade, and has remained persistently below 2,000 units for sale for much of the past two years. At the current sales pace there is a 2.3 month supply of condos available for sale, which is mostly unchanged from both year ago and previous month levels when there was a 2.2 month supply in both April 2014 and March 2015. As a result, the on-going shortage of listings continues to put upward pressure on prices and is preventing an even healthier rebound in sales activity from occurring, especially in suburban communities where few new units are being built.

 Only real estate professionals who are members of NATIONAL ASSOCIATION OF REALTORS® may call themselves REALTORS®. All REALTORS® must subscribe to NAR’s strict code of ethics, which is based on honesty, professionalism and the protection of the public.