

There are some industry pundits claiming that Boston area residential home values have risen too quickly and that current levels are on the verge of another housing bubble. It is easy to see how this thinking has taken form if we look at a graph of median Boston, Cambridge and Newton, MA single-family home prices from 1999 to today.
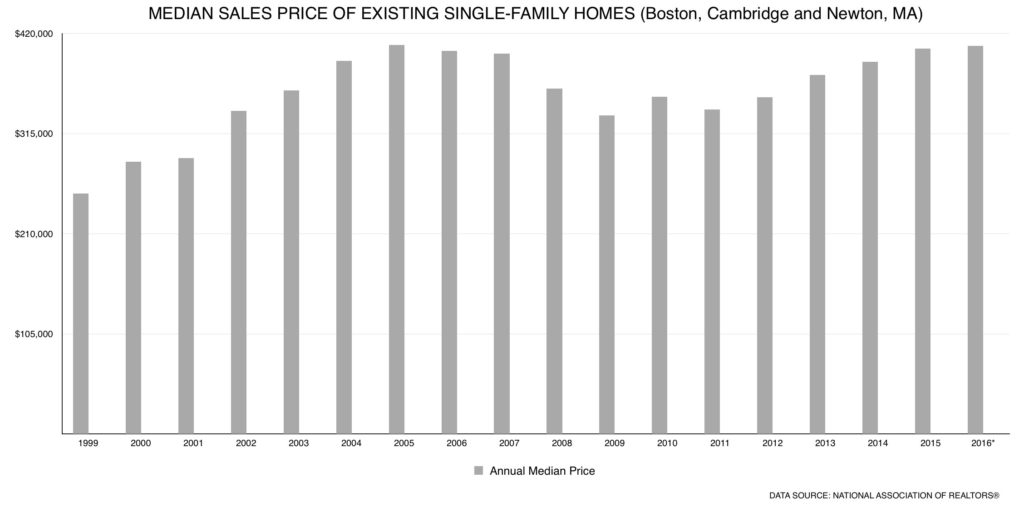
The graph definitely looks like a rollercoaster ride. And, as prices begin to reach 2005 levels again, it "seems logical" that the next part of the ride would be downhill. However, this graph includes the anomaly of the price bubble and the correction (the housing slowdown).
What If The Bubble + Slowdown Didnt Occur?
Let's assume that instead of the rise and fall in home prices that we saw last decade, we just had normal historic appreciation from 1999 to today. According to the 100+ experts that are surveyed for the Home Price Expectation Survey, normal annual appreciation for residential single family homes from 1987 to 1999 was 3.6%. Starting with the median home price in 1999, we added 3.6% to it each year since then. Here is that graph intermixed with the above graph.
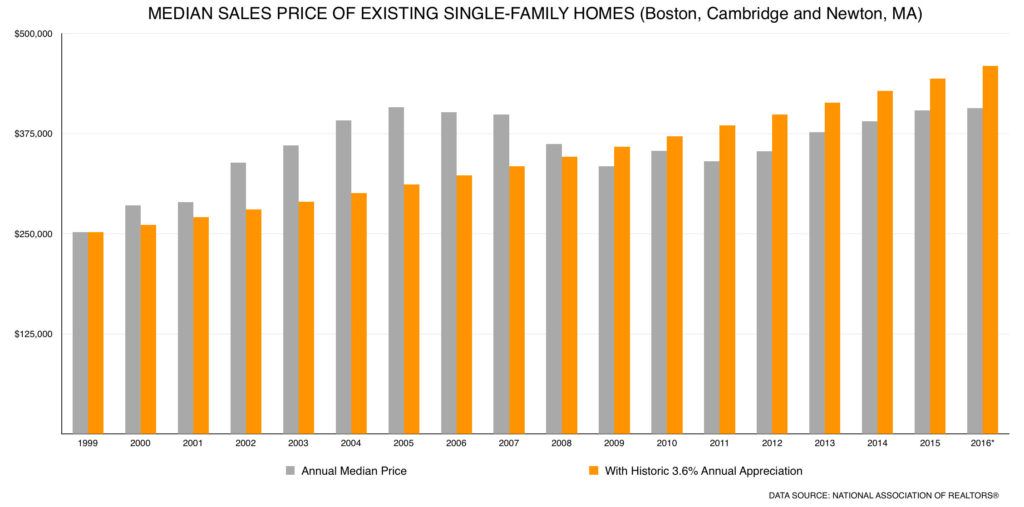
What this shows us is that, had the bubble and slowdown not occurred and instead we just had normal annual appreciation over this period, prices would actually be greater than they are today.
The Bottom Line
There is no reason for alarm as prices seem to be right in line with where they should be. Many thanks to our friends at KCM Blog for pointing the national trend which I've tailored to the Boston real estate market in this post.

 Only real estate professionals who are members of NATIONAL ASSOCIATION OF REALTORS® may call themselves REALTORS®. All REALTORS® must subscribe to NAR’s strict code of ethics, which is based on honesty, professionalism and the protection of the public.